How to convert p values into something useful
This is a supplementary post to the talk Evidence Based Fraud & The End of Statistical Significance – you may wish to start there, if you haven’t already.
There it was revealed that the common belief that p values (specifically 1 minus the p value) tell us the likelihood that a study finding is true was in fact a serious and dangerous misunderstanding. Instead it was revealed that p values are best conceptualised as “likelihood ratios” or “Bayes Factors” that convert pre-test probabilities (Pre-TP; aka prior probability) that a studied hypothesis is true into post-test probabilities (Post-TP; aka posterior probability) where the study in question is effectively the “test” and the p value attempts to represent the accuracy of this “test”. So the key to determining the meaning of a p value for a given finding, is first attempting to estimate what you believe the pre-test probability was before the study, based on biological plausibility and prior research.
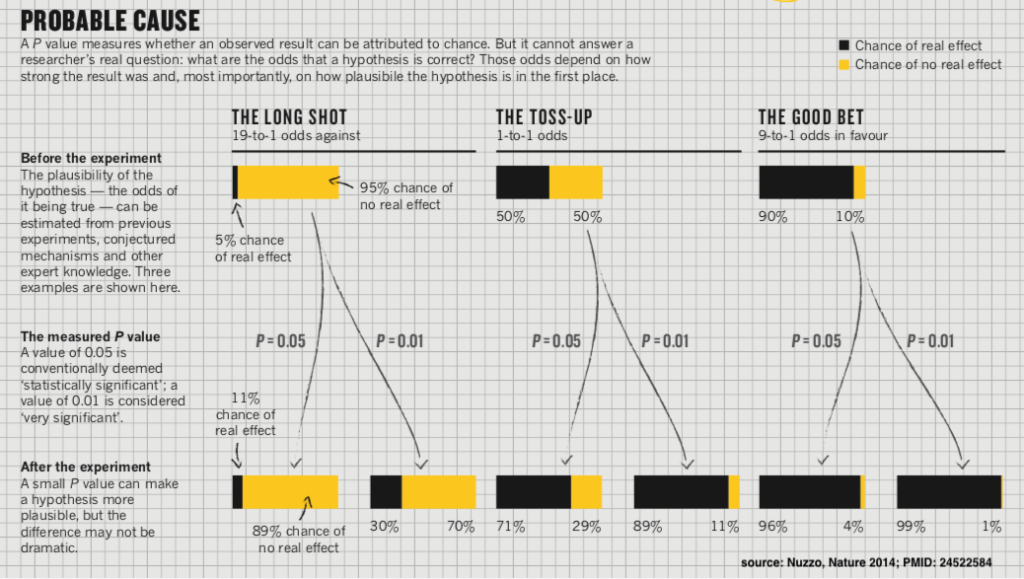
In the landmark article by Nuzzo (Nature 2014), this was beautifully represented in the following infographic.

andfonline.com/doi/full/10.1080/00031305.2018.1543135″ target=”_blank” rel=”noopener noreferrer”>Benjamin & Berger (American Statistician 2019) have provided recent guidance in converting p values into Bayes Factors (essentially likelihood ratios) that allow clinicians to calculate Post-TP from Pre-TP, as demonstrated in the above infographic.
If there is any bias in the study (almost always the case), this affects the validity of the p value calculation so any Post-TP calculated using these flawed p values are likely to be substantial over-estimates. So use this process as an optimistic guide to estimate bias inflated probabilities only and heavily discount (adjust downwards) these estimates for visible and presumed invisible bias, or reject the p values entirely as inapplicable if the bias is substantial.
Finally, never rely on the p values from a single study. An iron clad rule of EBM (and scientific enquiry more generally) is the need for repeated independent reproducibility of the data before you believe it, even if the Post-TP calculated from a single study’s p-value is appealing.
Bayes Factor Methodology Using P Values:
1. Estimate a pre-test probability that the hypothesis is true
- Base this on biological/logical plausibility and prior research.
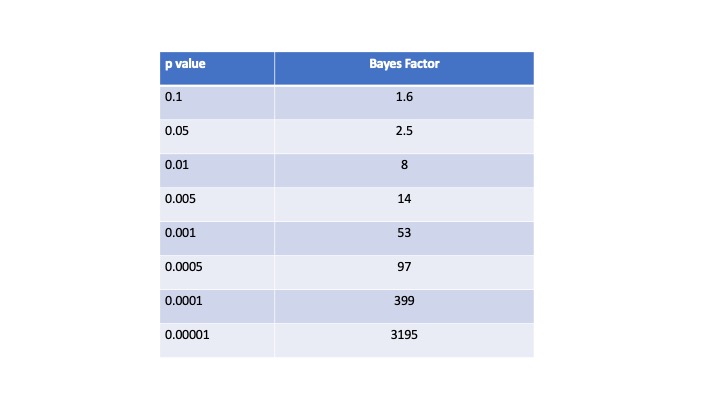
2. Convert the relevant study finding p value to a Bayes Factor (likelihood ratio). One prominent and simple methodology uses the calculation, Bayes Factor = 1/(-ep ln(p)). This provides the following Bayes Factors in this table:

3. Use Bayes Factors to convert the hypothesis Pre-TP into Post-TP
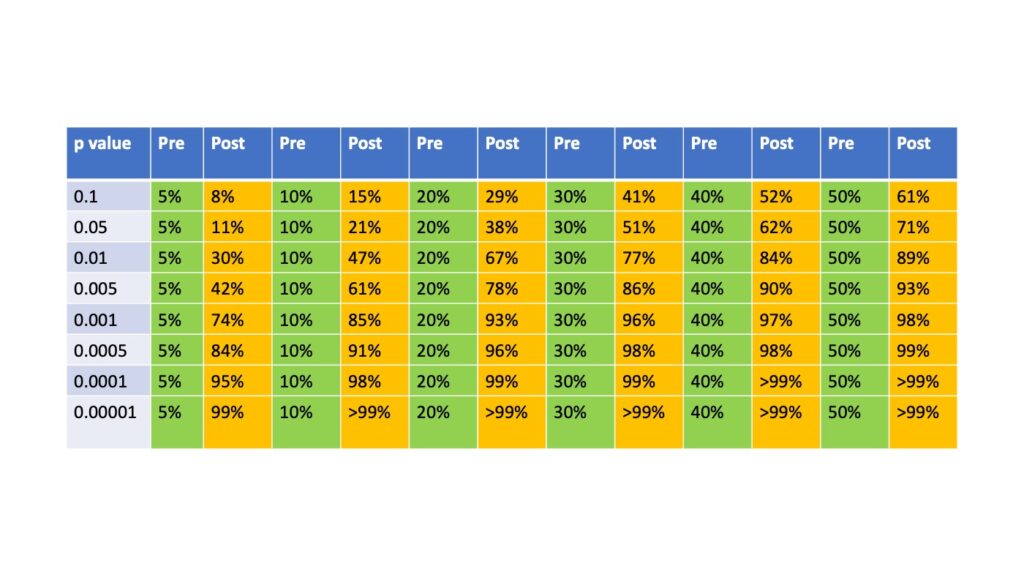
- Bayes Factors can be multiplied by pre-test odds to provide post-test odds. However probabilities are somewhat more intuitive and familiar to clinicians than odds, and converting Pre-TP into odds, applying Bayes Factor to reveal post test odds and then converting back to Post-TP adds unnecessary intellectual hassle when online calculators already exist that more simply calculate Post-TP from Pre-TP using likelihood ratios (like this one). Using these Bayes Factors and entering them into the calculators as likelihood ratios, reveals the following estimates of the Post-TP given a Pre-TP and p-value.

Example
Suppose you wished to study a new Hypothesis A and your prior belief is that the probability that Hypothesis A was true was 10%. You perform a study whose primary outcome reveals an effect that is in favour of Hypothesis A with a p value of 0.01.
Such a p value corresponds to a Bayes Factor from the first table above of 8.
Using the second table (or an online calculator) you can see that this implied Bayes Factor for a p value of 0.01 converts the Pre-TP to a Post-TP of 47%. So the the results of the study changes a very unlikely Hypothesis A into a 50-50 proposition.
However note that these are bias inflated probabilities as they have not be adjusted for the presence of bias in the scientific process, so the real probability that Hypothesis A is true is likely to be somewhat lower than 47%.
By contrast, imagine you are also wishing to study Hypothesis B, which has already been studied in a couple small trials already whose results suggest that there is a 50% chance of it being true at this stage. You perform a new study and the primary outcome is similarly in favour of this Hypothesis B with a p value of 0.01. Using the second table this converts the much higher Pre-TP to a Post-TP to a bias inflated Post-TP of 89%.
So despite the same p value from the 2 studies, Hypothesis B is provided substantially more support than Hypothesis A because the former was substantially more plausible prior to the studies being conducted, based on prior evidence.
Questions, comments and collaboration are welcome via comments below or our Contact page.
[This post was first published on EDguidelines.com 13/5/20 and was transferred and updated to this new EBM 2.0 project site on 8/10/20]

4 Comments. Leave new
Thank for the great work Anand!
I think there might be an error in the pre- and post Tp table
The vertical axis goes
0,01 (Error?)
0,05
0,01
0,005
0,001
Should the first number perhaps be 0,1?
thanks so much Peter for picking up that typo. You are right, the first p value was meant to be 0.1.
I have just corrected it now.
No worries 🙂
I think this stuff is inspiring (especially if you like the probabilistic way of thinking), and I am making a blog-post on our Emergency Medicine blog in Denmark (akutmedicineren.dk) about the EBM2.0 concept
All the best! And thank you so much for your work and for sharing your ideas!
excellent, thanks for spreading the word!